
Category:Environmental maps of the world
Subcategories
This category has the following 13 subcategories, out of 13 total.
*
A
F
G
L
M
O
W
Media in category "Environmental maps of the world"
The following 50 files are in this category, out of 50 total.
-
 2010 Global Greenhouse Gas Emissions.gif 600 × 400; 29 KB
-
 Above-ground biomass in forest per hectare, OWID.svg 850 × 600; 140 KB
-
 Acesso à água no mundo.svg 1,405 × 601; 359 KB
-
 Air pollution death rates.png 1,080 × 556; 290 KB
-
_and_atmosphere–land_(SLAND)_CO2_fluxes_to_(a)_increasing_atmospheric_CO2_concentrations_and_(b)_changes_in_climate%2C_averaged_over_the_previous_decade_2013–2022.png/120px-thumbnail.png)
-
 Carte des zones ECA dans le monde.gif 705 × 330; 31 KB
-
.png/120px-Change-in-total-mangrove-area_(OWID_0159).png) Change-in-total-mangrove-area (OWID 0159).png 850 × 600; 92 KB
Change-in-total-mangrove-area (OWID 0159).png 850 × 600; 92 KB
-
 Chemical contamination of drinking water-es.png 3,803 × 1,770; 481 KB
-
 Chemical contamination of drinking water.jpg 3,803 × 1,770; 638 KB
-
-
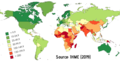
 Death-rate-from-air-pollution-map 2021 IHME.svg 809 × 563; 144 KB
-
_land_and_(b)_ocean_fluxes_for_RECCAP-2_regions_over_2013–2022.png/120px-Decadal_mean_(a)_land_and_(b)_ocean_fluxes_for_RECCAP-2_regions_over_2013–2022.png) Decadal mean (a) land and (b) ocean fluxes for RECCAP-2 regions over 2013–2022.png 2,067 × 3,400; 289 KB
Decadal mean (a) land and (b) ocean fluxes for RECCAP-2 regions over 2013–2022.png 2,067 × 3,400; 289 KB
-
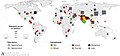
 E-waste dump site GDP per capita.png 738 × 338; 146 KB
-
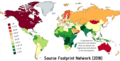 Ecological footprint 2018.png 1,080 × 552; 314 KB
-
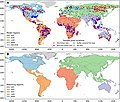
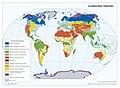 Ecoregiones terrestres en el mundo.jpg 1,388 × 1,016; 287 KB
-
.png/120px-Forest_Landscape_Integrity_Index_map_of_Earth%2C_2019_(forest_condition_by_degree_of_anthropogenic_modification).png)
-
 Forest-area-as-share-of-land-area.svg 850 × 600; 169 KB
-
 Gazy cieplarniane na osobę 2000.svg 940 × 477; 2 MB
-
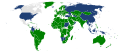
 GCF Members .png 882 × 455; 117 KB
-
 Gcf members map.png 882 × 450; 144 KB
-
 Global air pollution map.png 2,753 × 1,400; 212 KB
-
 Global areas of hypoxia.jpg 1,350 × 613; 111 KB
-
.jpg/120px-Global_monitor_station_distribution_and_mean_annual_PM2.5_concentration_over_two_decades_(2000–19).jpg)
-
 Guevara 2024 power plant emissions.png 2,067 × 1,826; 602 KB
-
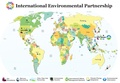 IEP overview copy.pdf 2,437 × 1,687; 19.4 MB
-
 Implementation-of-tools-to-monitor-economic-and-environmental-tourism.png 3,400 × 2,400; 836 KB
-

-
 Map of global forest loss and gain across decades from 1960 to 2019.jpg 1,725 × 1,247; 184 KB
-
 Map of methane emissions from four source categories.png 2,067 × 1,341; 322 KB
-
-
 Map Water scarcity.PNG 1,028 × 424; 343 KB
-
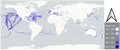
 Marine oil pollution map.png 1,425 × 625; 63 KB
-
 Methane emissions from three natural sources and one sink.png 2,067 × 1,211; 236 KB
-
Methane emissions from wetlands.webm 1 min 55 s, 1,920 × 1,080; 14.77 MB
-
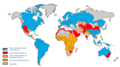 Nedostatek vody.png 1,339 × 744; 288 KB
-
 Niveles de ozono, año 2005, 02.png 640 × 480; 27 KB
-
 Precipitation and climate change.svg 960 × 749; 676 KB
-
 Projected share of global mismanaged plastic waste in 2025, OWID.svg 850 × 600; 141 KB
-
.svg/120px-Projected_share_of_inadequately_managed_plastic_waste_(2025).svg.png) Projected share of inadequately managed plastic waste (2025).svg 2,723 × 1,488; 1.49 MB
Projected share of inadequately managed plastic waste (2025).svg 2,723 × 1,488; 1.49 MB
-
.png/120px-Proportion-of-important-sites-for-freshwater-biodiversity-covered-by-protected-areas_(OWID_0891).png)
-
 Protection-of-the-rights-of-small-scale-fisheries.png 3,400 × 2,400; 843 KB
-
 Screenshot 614.png 1,346 × 618; 59 KB
-
 Share-degraded-land.png 3,400 × 2,400; 831 KB
-
 Soil moisture and climate change.svg 960 × 755; 861 KB
-
 Study regions and sample pixel locations of a deforestation study.jpg 892 × 759; 159 KB
-
 The 2011–2022 decadal mean components of the global carbon budget.png 2,067 × 1,447; 547 KB
-
 The 2013–2022 decadal mean components of the global carbon budget.png 2,067 × 1,447; 547 KB
-
 UNESCO global ocean deoxygenation map.png 937 × 509; 251 KB
-
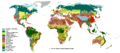 Vegetation with cities.png 1,425 × 625; 88 KB
-
 World GHI Solar-resource-map GlobalSolarAtlas World-Bank-Esmap-Solargis.png 1,889 × 1,122; 1.51 MB


_and_atmosphere–land_(SLAND)_CO2_fluxes_to_(a)_increasing_atmospheric_CO2_concentrations_and_(b)_changes_in_climate,_averaged_over_the_previous_decade_2013–2022.png)

.png)


_land_and_(b)_ocean_fluxes_for_RECCAP-2_regions_over_2013–2022.png)


.png)


.jpg)


.svg)
.png)


